April 17, 2026
The social media platforms and news aggregators have seen an unprecedented spike in the phrase “Tsunami Warning.” While the term usually sparks immediate panic, today’s trend is rooted in a monumental leap for planetary science and oceanography. NASA and the European Space Agency (ESA) have just released the first-ever high-resolution satellite images of a tsunami wave field moving across the Pacific Ocean. Captured by the Surface Water Ocean Topography (SWOT) satellite, these images represent the first time humanity has “seen” the complex, two-dimensional structure of a major deep-ocean tsunami from space, transforming it from a theoretical model into a visible, measurable reality.
The imagery stems from a magnitude 8.8 earthquake that struck the Kamchatka Peninsula region earlier this year. While the event itself was monitored by traditional seismic sensors, the SWOT satellite happened to be in the perfect orbital position just 70 minutes after the rupture. The resulting data, refined and released to the public today, shows a 120-kilometer-wide swath of the ocean surface with centimeter-level precision. Unlike previous satellites that could only provide a single “slice” or line of data, SWOT has provided a topographical map of the water’s surface, revealing that tsunamis are far more complex than the “single wall of water” often depicted in popular media.
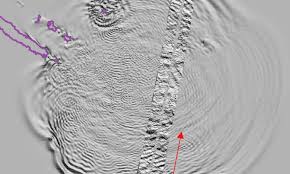
The significance of these high-resolution images lies in the detection of “dispersive waves.” When a massive underwater earthquake occurs, it doesn’t just create one wave; it creates a sequence of smaller, trailing waves that carry vital information about the seafloor’s movement. “SWOT transforms our satellite observations of tsunamis from one-dimensional slices and points to a snapshot of sea-surface height across a broad area similar to a topographical map,” said Alice Gabriel, a renowned seismologist at the Scripps Institution of Oceanography. “Being able to see the patterns of bumps and dips in the sea’s topography allows us to figure out what happened at the trench, something no other observing system has been able to deliver.”
This data is effectively a “fingerprint” of the earthquake itself. By analyzing the wave patterns captured in these images, scientists have been able to work backward to determine that the earthquake rupture was nearly 400 kilometers long—significantly larger than initial seismic estimates suggested. This “visual evidence” allows researchers to pinpoint exactly where the tectonic plates slipped, even in the deepest, most inaccessible parts of the ocean trench. The ability to see these details is crucial because the shallowest part of the fault, near the ocean trench, is often responsible for generating the most devastating waves, yet it has historically been a “blind spot” for researchers.
The reason for the current “trending” status is twofold: the sheer visual beauty of the high-definition ocean maps and the launch of a new AI-driven integration system. Today, scientific agencies are demonstrating how this satellite data can be combined with the GUARDIAN (GNSS Upper Atmospheric Real-time Disaster Information and Alert Network) system. This experimental technology detects tsunamis by measuring how the displaced water pushes the atmosphere upward, creating ripples in the ionosphere that interfere with GPS signals. “The main impact that this observation has for tsunami modelers is that we are missing something in the models we used to run,” noted researcher Angel Ruiz-Angulo. “This ‘extra’ variability could represent that the main wave could be modulated by the trailing waves as it approaches the coast.”
While the images are a triumph of physics and engineering, the trending “warning” also coincides with Pacific Tsunami Preparedness Month. Authorities in coastal regions like British Columbia, Japan, and the U.S. West Coast are using the viral nature of these satellite images to conduct large-scale evacuation drills and educational campaigns. They are making it clear that while these satellites provide a “new pair of glasses” for scientists, the goal is to turn this data into faster, more accurate early warning systems for the public. Instead of waiting for a wave to hit a physical buoy (DART station) in the middle of the ocean, future warnings could be issued based on real-time “visual tracking” of the sea surface from orbit.
“Capturing this tsunami with SWOT near its source gave us crucial data on the earthquake rupture, how it generated the resulting tsunami and the physics playing out near the trench,” Gabriel added in her briefing. This sentiment is echoed by the global scientific community, which views April 17, 2026, as the day oceanography entered the age of high-definition. The ability to see wave direction, spacing, and curvature from hundreds of miles above the Earth allows for a Boussinesq-type modeling—a sophisticated mathematical approach that accounts for wave dispersion—which was previously impossible to verify with real-world open-ocean data.
For the general public, the trending news is a mixture of awe and relief. The images show the Pacific Ocean not as a static blue void, but as a living, breathing canvas reacting to the immense tectonic forces beneath it. Agencies have been quick to reassure everyone that there is no active tsunami threat today; rather, the “warning” is a tribute to the new technology that ensures we will be much better prepared when the next real threat emerges. The integration of satellite altimetry, AI detection, and ionospheric monitoring marks a new era where we are no longer “blind” to the movements of the deep.


